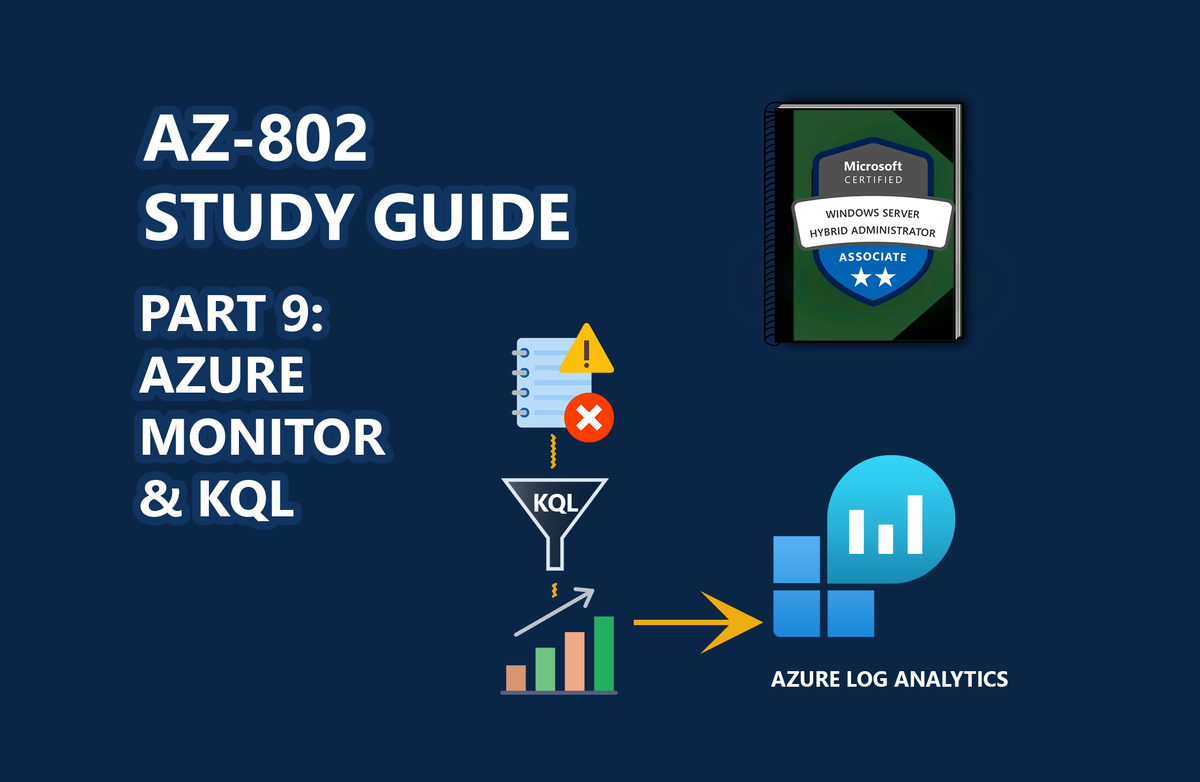
📖 AZ-802 Study Series: This is Part 9 of my hands-on lab series leading up to the Microsoft AZ-802 exam. To see the preceding steps, check out Part 8: Taming Local Storage Bloat, Part 7: Building a Windows Failover Cluster, Part 6: Centralizing Fleet Patching, Part 5: Onboarding Servers to Azure Arc, Part 4: Bridging On-Prem AD with Entra ID, Part 3: Automating Replica Domain Controller Promotion, Part 2: Automating Windows Server Lab Setup, and Part 1: Building a Multi-DC Active Directory Forest, or check out The Ultimate Guide to Windows Server Hybrid Administrator Associate (AZ-802) Study Guide for the complete roadmap.
In a hybrid enterprise environment, diagnosing errors across isolated servers can feel like finding a needle in a haystack. Relying on remote desktop sessions to open Windows Event Viewer on individual servers is highly inefficient and creates security risks.
To establish centralized logging and pass the Microsoft AZ-802 monitoring syllabus, you must deploy the Azure Monitor Agent (AMA) on local hosts. This agent collects Windows Event Logs and securely streams them to a cloud-based Log Analytics Workspace, allowing you to run cross-server diagnostics using Kusto Query Language (KQL).
🎓 Exam Alignment (Monitoring & Diagnostics):
Setting up hybrid monitoring and querying logs using Azure Monitor are core syllabus metrics under the "Monitor and Manage Windows Server Environments" domain of the AZ-802: Configuring Windows Server Hybrid Advanced Services exam. You must know:
- Azure Monitor Agent (AMA): Deploying the AMA extension to Azure Arc-enabled hosts and managing agent lifecycle tasks.
- Data Collection Rules (DCRs): Designing DCR scopes to target specific servers, filter specific event logs (System/Application/Security), and restrict ingestion data costs.
- KQL Query Construction: Writing basic Kusto Query Language syntax to filter by time, query event sources, summarize log occurrences, and isolate critical errors.
- Alerting Frameworks: Integrating KQL query outputs with Azure Monitor Action Groups to trigger automated SRE notifications or playbooks.
The Log Collection Pipeline
The log ingestion pipeline structures how data moves from local servers to the cloud:
graph LR
    LocalServer["On-Premises Server (AMA)"] -->|Data Collection Rule (DCR)| LogAnalytics["Log Analytics Workspace"]
    LogAnalytics -->|Queries| KQL["Kusto Query Language Console"]
- Azure Monitor Agent (AMA): Replaces the legacy Log Analytics agent, providing secure, resource-efficient event log parsing.
- Data Collection Rules (DCR): Configuration objects defined in Azure that determine which logs (e.g., Security, Application, System) are collected and where they are sent.
- Log Analytics Workspace: The central cloud repository where logs are indexed, stored, and queried.
Step 1: Deploying the Azure Monitor Agent
First, ensure your local servers are connected to Azure Arc (see Part 5). Then, save and run this PowerShell script to deploy the agent:
# AZURE MONITOR AGENT SETUP & DIAGNOSTICS UTILITY
# Brand: Reprodev
# Run this from an Administrator PowerShell console on the target server.

# 1. Configuration Variables
$WorkspaceId         = "your-workspace-uuid"
$WorkspaceKey        = "your-workspace-shared-key"

# 2. Download the Azure Monitor Agent (AMA) Windows installer
$DownloadPath = Join-Path $env:TEMP "AzureMonitorAgent.msi"
Invoke-WebRequest -Uri "https://aka.ms/azuremonitoragentwindows" -OutFile $DownloadPath -UseBasicParsing

# 3. Install the MSI package silently
Start-Process msiexec.exe -ArgumentList "/i `"$DownloadPath`" /qn /norestart" -Wait
Step 2: Creating the Data Collection Rule (DCR)
- Log into the Azure Portal and search for Monitor.
- Select Data Collection Rules -> Create.
- Fill in the parameters:
- Rule Name:
dcr-hybrid-events. - Platform Type: Select Windows.
- Rule Name:
- In the Resources tab:
- Click Add resources and select your Arc-enabled local servers.
- In the Collect and deliver tab:
- Click Add data source -> select Windows Event Logs.
- Check the log channels you want to collect: System, Application, and Security (Audit Success and Audit Failure).
- Under Destination, select Azure Monitor Logs and assign your Log Analytics Workspace.
- Click Create. The agent will pull the rule configurations automatically.
Step 3: Troubleshooting with Kusto Query Language (KQL)
Once log collection is active, open the Log Analytics Workspace, click Logs, and run these queries to isolate errors:
1. View System Warnings and Errors by Computer
Find which servers are reporting the highest frequency of errors to focus troubleshooting:
Event
| where TimeGenerated > ago(24h)
| where EventLevelName in ("Error", "Warning")
| summarize count() by Computer, Source, EventLevelName
| order by count_ desc
2. Track System Boot and Shutdown Logs
Audit reboot intervals on your servers (Event ID 6005 represents the event log service starting, signaling a system boot):
Event
| where TimeGenerated > ago(7d)
| where EventID in (6005, 6006)
| project TimeGenerated, Computer, EventID, Source, RenderedDescription
| order by TimeGenerated desc
3. Track Failed Administrator Logins
Audit authentication failures across the fleet to detect potential security breaches:
SecurityEvent
| where TimeGenerated > ago(12h)
| where EventID == 4625
| where TargetUserName == "Administrator"
| summarize count() by Computer, IpAddress, LogonType
Critical Gotcha: The Audit Policy Block
[!WARNING]
If your Log Analytics workspace is not receiving security events, the local group policy may not be auditing logons.To resolve this, verify that your local Active Directory domain policy or member server local policy has enabled auditing:
- Open Group Policy Management Console (GPMC).
- Navigate to: Computer Configuration -> Policies -> Windows Settings -> Security Settings -> Local Policies -> Audit Policy.
- Ensure Audit logon events and Audit account logon events are set to track Success and Failure.
Key Takeaways
- AMA replaces Log Analytics Agent: The legacy agent is retired. All new hybrid deployments must use the Azure Monitor Agent and Data Collection Rules.
- DCRs provide granular control: Use DCRs to limit log collection to critical security and error logs, keeping data ingestion costs low.
- KQL is a superpower: Writing simple KQL queries allows you to monitor and audit log metrics across hundreds of local and cloud servers from a single interface.
Don't forget to explore the rest of our website as we build out more content. Stay tuned for more tutorials, tips, and tricks to help you make tech work for you.
If you want to stay up-to-date with regular updates, make sure to subscribe to our free mailing list.